
How intensity profile drawings transform ESM / EMA assessment.
TL;DR
In experience sampling (ESM) / ecological momentary assessment (EMA) we often assume that snapshots represent the full picture of someone’s everyday life. But research using intensity profile drawings shows that we miss major fluctuations and meaningful episodes that unfold between snapshots. In this invited blogpost, Dr. Leonie Cloos explains how continuous drawings fill those gaps and help researchers capture a more complete movie of change.
Imagine watching only the trailers of the entire Lord of the Rings trilogy and assuming you now know the full story (and don’t need to sit through 9-12 hours of movie time! 🥱).
The trailers show major characters and plot points, but they miss the real magic: unlikely friendships, heroic and tragic developments, and the twists that keep you on the edge of your seat.
This raises the question: If you only see snippets, can you ever understand the full movie?
This is exactly the challenge we face in experience sampling (ESM) / ecological momentary assessment (EMA). We collect short, isolated snapshots of people’s lives and hope to make a movie from these time-contingent sampling schemes.
But what if the snapshots don’t represent the most important moments of the movie?
Many blind spots
When we track continuously unfolding processes like emotions in everyday life using snapshots, we capture random frames, not the highlights, not the low points.
And sometimes, important moments are never recorded because people tend to skip assessments when they feel worse. That means that we don’t even see some of the most relevant scenes.
Suppose someone feels very bad at one snapshot and better at the next. We might infer they recovered. But how did this happen?
- How long did it take?
- Did they bounce back or climb back gradually?
- Did something make them feel even worse before they got better?
- Was there something positive that lifted them up rapidly?

Here are two core issues, highlighted in the following figure:
- The last two snapshots show recovery. But the true underlying affect got worse before it improved. The snapshots completely hide this pattern.
- Between the second and third snapshot there is a clear affective episode, but the data captures two similar subsequent values with no indication of a change in between.
Affective processes change at a higher rate than ESM / EMA assessments can capture. There may be more to the data than meets the eye!
How intensity profile drawings capture the movie
A powerful way to fill in the gaps is surprisingly simple: Let participants visually draw their affect between two ESM / EMA assessments.
The idea goes back to Sonnemans and Frijda, who developed a procedure that enabled participants to draw the course of their recalled emotions in the lab. Verduyn and colleagues extended this procedure to real-time emotions. They showed that to understand affect, we must capture its full temporal unfolding, not isolated snapshots.
With the help of Dr. Leonie Cloos and colleagues, the m-Path team brought this approach into an actual ESM / EMA study. Here is how:
- Through a semi-random sampling scheme, 115 participants rated their momentary positive and negative affective state across repeated moments for one week, six times per day.
- The values of these ratings became the start and end points in the continuous drawing.
- Participants drew their changes in between these time points across the timeline in between beeps.
An example assessment of the continuous line item in m-Path.
For the first time, we could see continuous change across the day. This simple addition turned isolated snapshots into a movie 🎥.
What we found
1. Change in between emotional assesments is not linear.
When researchers compared the linear change implied by snapshots versus the trajectory participants actually drew, the difference between the line and the drawing averaged 7 points on a 0-100 slider scale.
A 7-point average deviation means the emotional process we model from snapshots is often not the one participants actually lived. We are, quite literally, watching the wrong movie.
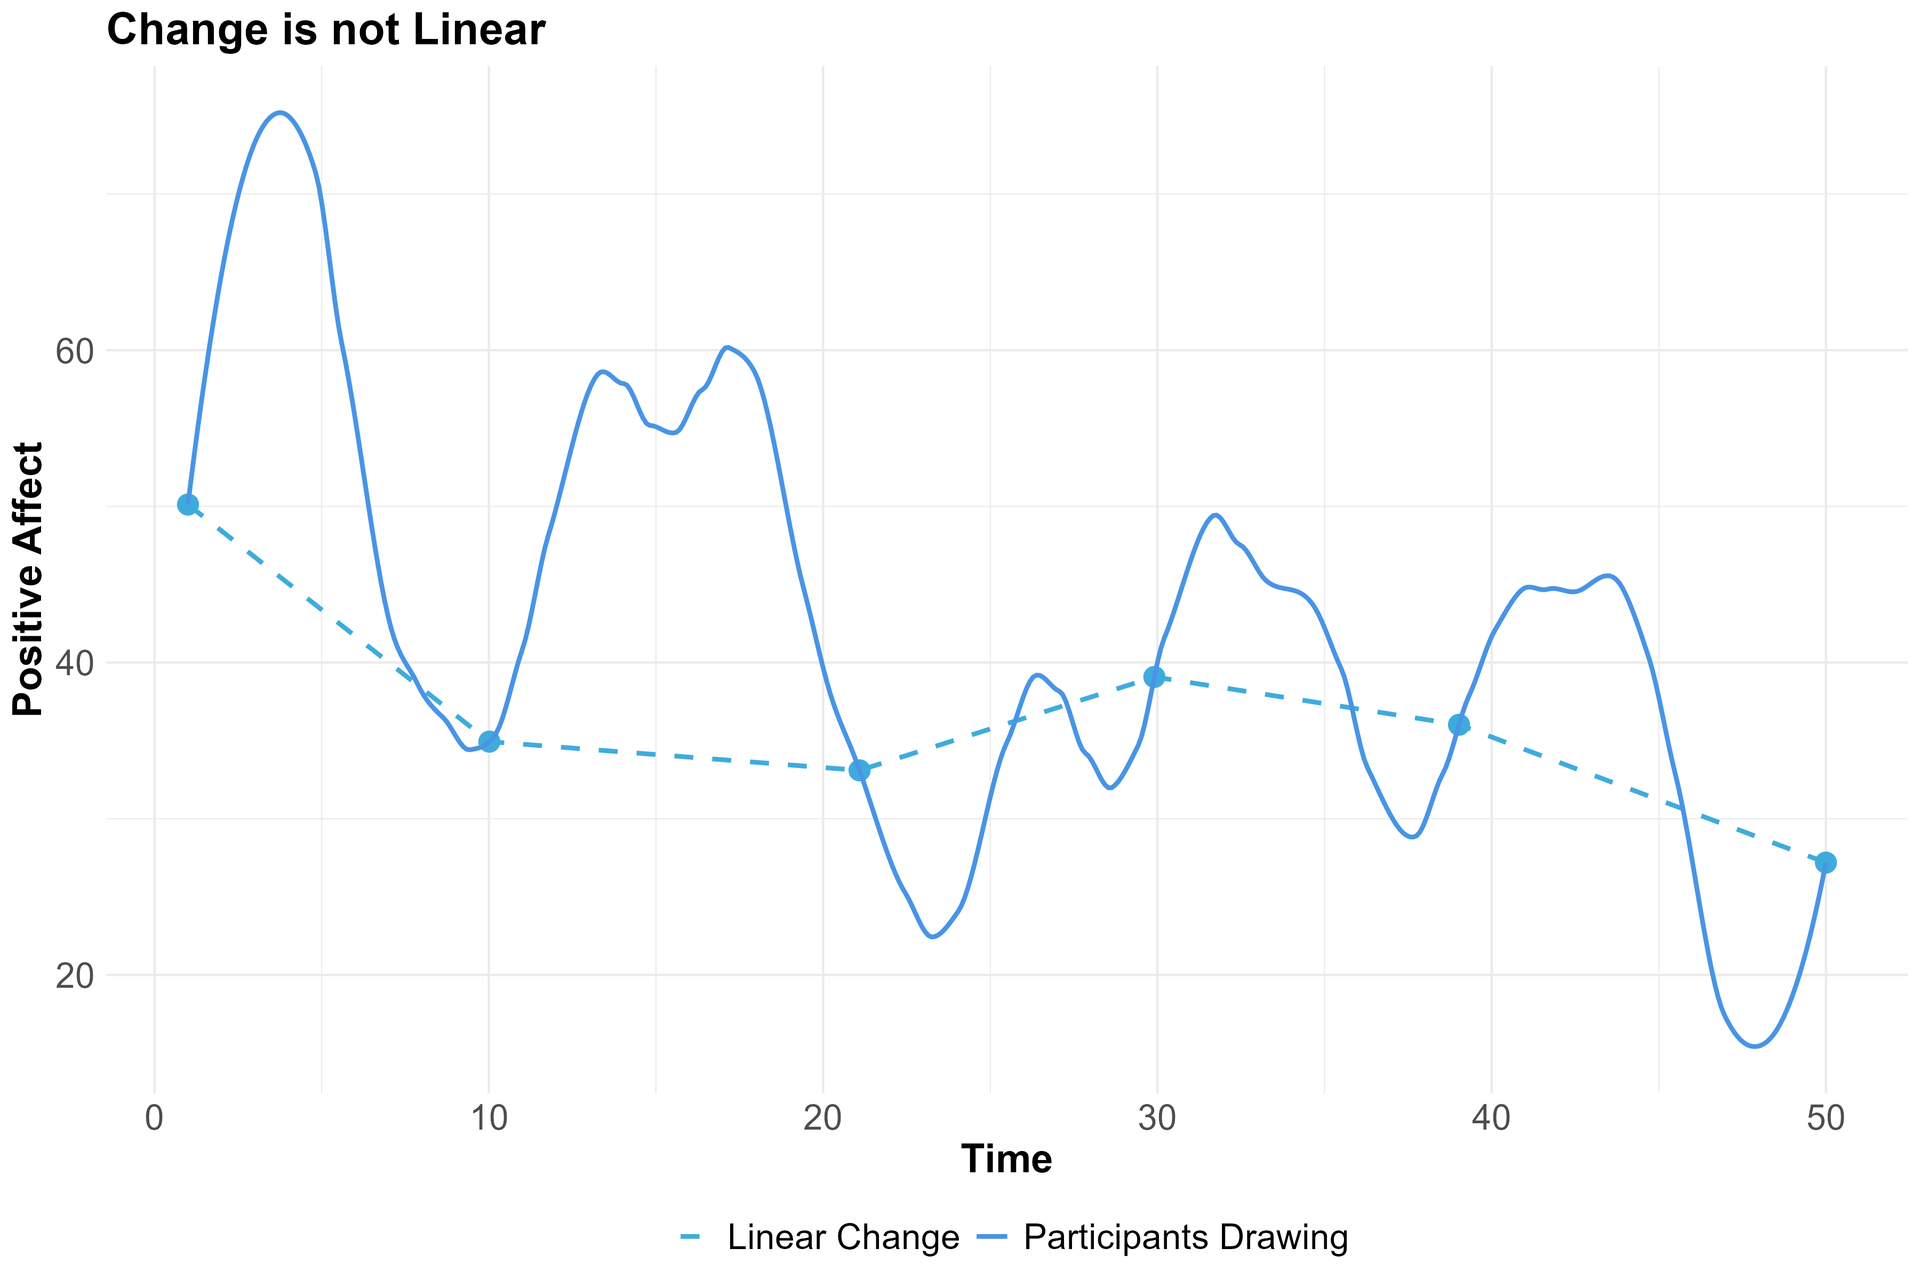
Simulated time series showing how snapshots may mask non-linear emotional change.
Key take-away: You are missing a large amount of information assuming that the change from one point to the next is linear.
2. There are many more affective episodes than we think.
Intensity profile drawings reveal emotional peaks and valleys that snapshots often miss entirely.
On average, participants reported:
- 12 negative affect episodes (peaks or deep valleys)
- 9.5 positive affect episodes
… during just one week of daily-life measurement. We are missing the story development.
Key take-away: Affective episodes are not noticed in regular ESM / EMA assessments. They are more fine-grained and often happen in between beeps.
3. Missing data can be recovered.
This benefit is especially exciting for ESM / EMA researchers. If participants miss a notification, the next drawing anchors back to the last available data point.
Key take-away: The drawing can reconstruct any missed assessment. You can impute your ESM / EMA data with real values.
4. Less notifications = Less burden
Because intensity profile drawings provide a continuous timescale, researchers can capture longer emotional trajectories, without increasing the sampling rate.
In a clinical context, therapists may decrease the burden on their clients, and still gain the maximum insight into changes in their well-being.
Key take-away: You obtain more information in an ESM / EMA study, without increasing significant assessment burden.
Practical take-aways
The implementation of intensity profile drawings may be an enormous advancement for ESM / EMA research in different domains. They let you:
- detect full episodes or event trajectories
- model recovery processes more accurately
- identify patterns that are hidden by snapshots
- reduce participant burden
- better understand how affect unfolds after meaningful events
- support long-term monitoring in clinical settings
The method allows you to track affect almost as it happens, rather than only capturing it when a notification appears.
This is why the m-Path team is working on an extension of this method so participants can mark events directly on the trajectory. This will allow researchers to study triggers, peaks, turning points and recovery in unprecedented detail.
Why this matters for your research
Do you want to try intensity profile drawings in your ESM / EMA research?
- Do you want to capture your participants’ emotional lives without missing a single moment of what happens between beeps?
- Are you looking for a method that lets you follow people over longer periods without increasing their burden?
- Do your participants love giving richer information than standard rating scales allow? Are they more visual than numeric?
Then intensity profile drawings may be exactly what you need.
Check out our dedicated manual page on the continous line item to implement intensity profile drawings in your ESM / EMA study.
👉 Explore the full paper here: Assessment, 2024.