Detecting participation effects in ESM / EMA research.
TL;DR
Experience sampling methodology (ESM) / ecological momentary assessment (EMA) studies give us rich real-life data, but participation itself can change how participants behave, what they experience and report. A new pre-print led by PhD candidate Eveline Gieles, and co-authored by the m-Path team, proposes a taxonomy of these “measurement-induced changes”, and explains how to detect and prevent them.
Experience sampling methodology (ESM) / ecological momentary assessment (EMA) is widely celebrated for its ecological validity. We (implicitly) assume that when participants report their feelings, symptoms or behavior during daily life, the data reflects what’s really happening.
But here’s the catch: repeatedly measuring people can change them.
Just like checking your step count can motivate you to walk more, filling out ESM / EMA surveys might make people more aware of their feelings or behavior, change their routines, or even subtly shift how they interpret questions. These effects can creep into your data, and distort your conclusions.
So how do we tell apart true change from measurement-induced change?
A taxonomy of change: Making the invisible visible
When participants repeatedly report their momentary experiences, their data might change over time, not just because their lives change, but because of the act of measurement itself.
Our paper proposes a framework to break down these hidden participation effects into clearer categories. Think of it as a map of all the ways ESM / EMA data can shift over time.
Below we discuss the main sources of such measurement-induced change, with simple examples.
1. Measurement reactivity
Participants genuinely change their thoughts, feelings, or behavior because they gain new insights from repeatedly reflecting on them.
Example: A participant notices through the surveys that they often feel stressed after scrolling social media. They decide to cut back their screen time, so their stress scores drop, not because life got calmer, but because they learned something from ESM / EMA itself.
2. Measurement interference
Participation temporarily disrupts daily routines or behaviors, not because participants change psychologically, but because they adapt to the protocol.
Example: At first, someone avoids napping during the day because they don’t want to miss survey prompts. Later, as motivation drops, they nap again, making it look like their tiredness has increased over time.
3. Reconceptualization
Participants change what they believe the construct actually means.
Example: Early in the study, someone sees “stress” only as time pressure (like rushing to meet deadlines). Later, they also count emotional conflicts or financial worries as “stress”, so their reported stress levels rise, even if their daily life hasn’t changed.
4. Recalibration
Participants change how they use the response scale, shifting what the numbers mean to them.
Example: A stress level they used to rate as 75 on a 0-100 scale is now rated as 65, because they’ve experienced something far worse and adjusted their mental scale. The same feelings now get lower scores.
5. Introspection
Participants become better at noticing and describing their internal states, making their reports more precise over time.
Example: At first, someone just reports “bad” when they feel off. By week two, they distinguish between feeling anxious, angry, or sad. Their answers change because their self-awareness sharpened, not because their emotions actually shifted.
6. Declining effort (careless or insufficient effort responding)
Participants gradually pay less attention to questions or try to finish surveys quickly.
Someone starts off carefully reading each item, but by week two just taps the same number every time. The data suggests their mood is stable, when in reality their motivation just collapsed.
7. Systematic change in compliance
The pattern of when participants respond shifts, especially if they start skipping certain kinds of moments.
Early in the study they answer even when feeling stressed, but later they skip those stressful moments. This creates an artificial decline in stress levels in the dataset.
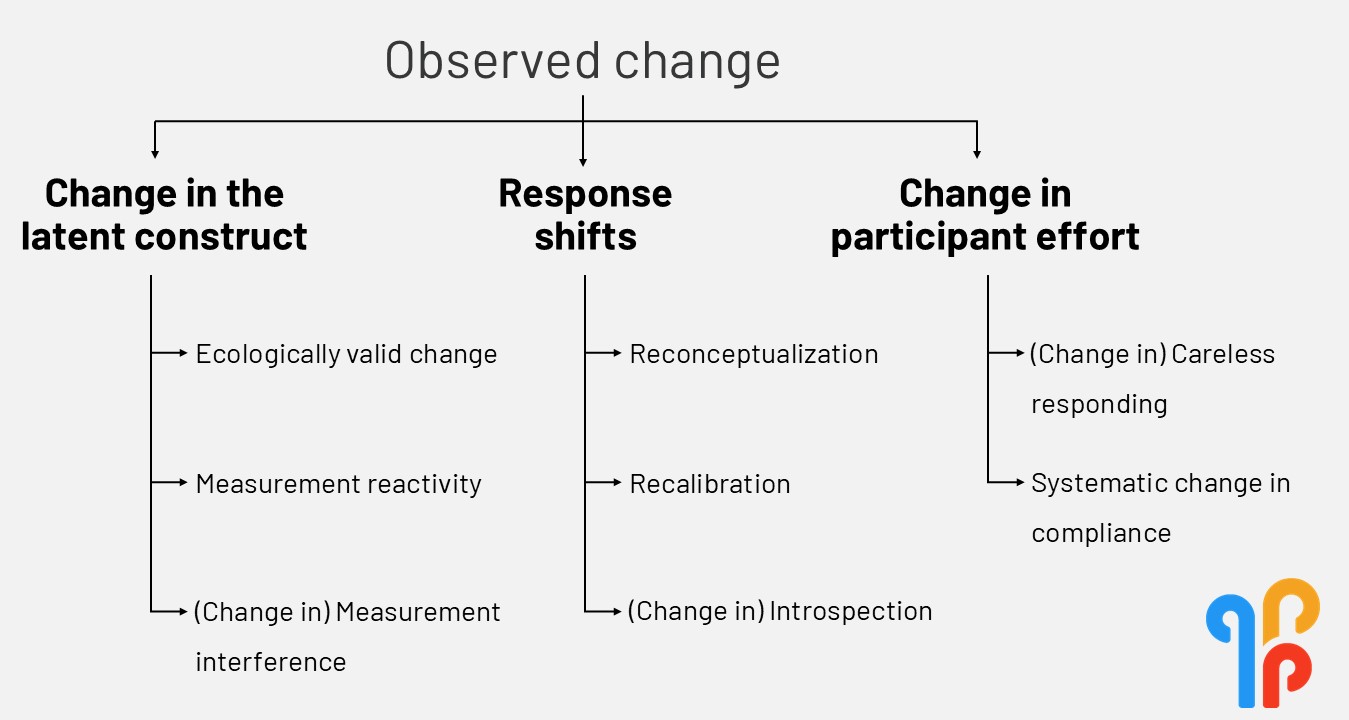
Visual overview of measurement-induced effects in ESM / EMA research.
These measurement effects don’t just produce temporal changes in mean levels. They can alter variability, autocorrelation, and associations between variables, core metrics in ESM / EMA research. If we ignore this, we risk drawing the wrong conclusions about psychological processes.
Why this matters for your research
Our taxonomy isn’t meant as the final word on participation effects. It’s a starting point. We created it to help researchers move from simply observing changes in their data to actually understanding where those changes come from.
To push this work forward, we see three crucial next steps.
1. Test these mechanisms directly and indirectly
Most studies only look for overall trends (e.g., “Did stress decrease over time?”), but that misses why data shifts.
We need studies that directly ask participants about perceived changes (e.g., interviews on introspection, response scale use, effort) and studies that infer patterns indirectly, using statistical tools (e.g., measurement models) or converging data sources like passive sensing or retrospective reports.
Only by linking what participants say and what their data show can we identify which mechanisms are truly at play.
2. Experiment with design elements
We also need studies that manipulate design features to see which sources of change they trigger.
For instance, giving participants feedback might increase measurement reactivity, while gamification may improve compliance but reduce response quality. Practicing ESM / EMA beforehand could stabilize introspection, while showing previous responses might reduce recalibration.
Treat design features not as fixed settings, but as levers you can test, and monitor their side effects across all sources of change.
3. Explore moderating factors
Not every participant, construct, or context reacts the same.
People low in emotional awareness might show stronger introspection effects as a result of ESM / EMA. Complex constructs might be more prone to reconceptualization. Highly stressful contexts might amplify affective interference.
Mapping these moderators will help us predict when and for whom participation effects are most likely to bias ESM / EMA data.
A collective step toward greater ecological validity
Ultimately, these measurement-induced effects aren't just a technical issue. If they go unnoticed, they can distort the phenomena we think we’re studying.
Understanding how participation shapes data will make ESM / EMA research more robust, reliable, and ecologically valid, preserving its greatest strength.
Thus, if you run ESM / EMA studies, pause and ask yourself:
- Could participation itself be reshaping my data?
- How might I measure or control for that in my design?
This is a new frontier in ESM / EMA research, and tackling it will take a collective effort. We hope our taxonomy sparks that conversation.
👉 Explore the full paper here: xxx.