Visualizing previous ratings improves measurement in ESM / EMA studies.
TL;DR
Our study demonstrates that showing participants' previous emotion rating during
experience sampling (ESM) / ecological momentary assessment (EMA)
surveys leads to more reliable, externally valid, and user-friendly responses. This simple tweak not only boosts data quality, but also creates greater consistency in how rating scales are interpreted both within and across individuals.
Why momentary (emotion) ratings can be tricky
If you’ve ever been asked “How happy are you right now?” on a 0–100 scale, you know it’s not that straightforward. What does a “42” really mean? Without a reference point, absolute scales may feel ambiguous and ratings arbitrary.
And consider this: if you rated an intense argument with a friend as “0” happiness, how could you then capture the even deeper sadness of learning that the same friend tragically died in a car accident on the next measurement occasion (an extreme example, but it illustrates the problem clearly)? The artificial bounds of absolute scales leave no room to update the calibration of the rating scale.
Researchers who rely on experience sampling methodology (ESM) / ecological momentary assessment (EMA) implicitly face these challenges when they design their study. Participants rate their emotions multiple times a day, but those absolute scales are vulnerable to noise, shifting and different interpretations within and across individuals, and artificial bound effects. This can impact the quality and ecological validity of collected data.
Although absolute rating scales are considered "the gold standard" when it comes to assessing psychological phenomena in daily life, these issues are hardly recognized, let alone addressed. In a real-life experiment, our m-Path team considered two alternatives that could overcome these shortcomings.
Two relative slider scales
We recruited 178 participants for a 12-day ESM / EMA study. Using the m-Path app, each participant received 10 notifications per day to evaluate their current emotions. Adopting a within-person design, every 4 days, the response format changed:
- Absolute scale (ABS): Participants rated their emotions on the standard 0–100 slider.
- Absolute + Anchor (ABS-REL): The same slider, but now with a visual “Last” anchor marking their previous rating.
- Relative scale (REL): Participants compared their current emotion to the previous one on a -50 (much less) to +50 (much more) scale, with 0 indicating no change.
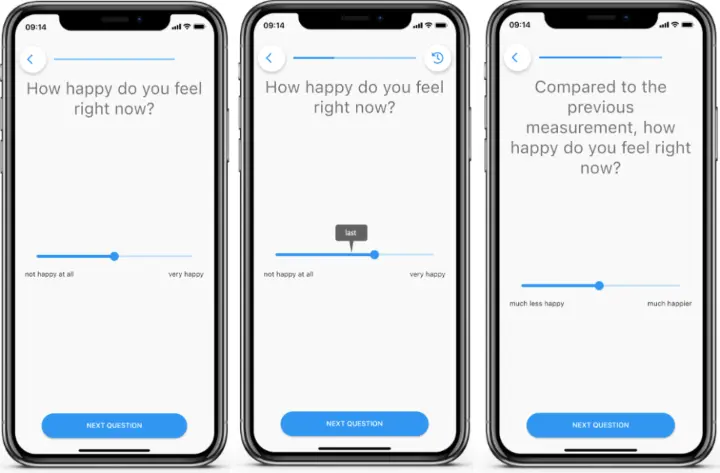
m-Path screenhots illustrating the traditional absolute scale (ABS), the anchored absolute scale (ABS-REL), and the purely relative slider scale (REL).
To evaluate the usability of each scale, we determined five key criteria:
- User experience: Did people find it natural, easy, and accurate? Would they want to use it again?
- Internal validity: Did the ratings capture real emotional ups and downs, or were they mostly noise?
- Reliability: Were the emotion dynamics (like variability and inertia) consistent when we split the data in half?
- Single predictive power: Could the ratings meaningfully predict traits like neuroticism and borderline symptoms (i.e., two characteristics associated with emotional variability)?
- Added predictive power: Do the ratings meaningfully predict these traits when controlling for simple mean differences in emotion levels?
Together, these criteria helped us see not only which method felt best for participants, but also which one delivered the most trustworthy data for researchers.
A clear winner and loser
Here is what we found:
1. People preferred the anchored absolute scale.
Participants generally rated the ABS-REL method (with the “Last” anchor) as the easiest, most accurate, and most reliable way to report their emotions.
2. Relative phrasing didn’t work.
The fully relative scale (−50 to +50) caused confusion, drift, and poor reliability. Participants disliked it, and the data quality suffered.
3. Adding "Last" anchors provided less noisy data.
Emotion time series from the anchored scale showed less measurement error compared to the traditional absolute scale, suggesting the ups and downs better reflected real emotional change.
4. More stable emotion dynamics.
Person-level measures like variability and inertia were more stable when derived from anchored scales, giving researchers more trustworthy indicators of people's emotional life.
5. Stronger links to external traits.
Emotion dynamics from the anchored method were better predictors of personality characteristics such as neuroticism and borderline symptoms (even after taking into account differences in mean levels of emotionality).
Why this matters for your research
If you’re designing an ESM / EMA study on emotions (but also other types of ratings could benefit from it), consider adding a relative “Last” anchor to your scales. It:
- Provides participants with a clear reference point.
- Improves comparability across people and time.
- Boosts the validity of (emotion) dynamics measures.
The best part? This adjustment requires no complex redesign! It’s a lightweight, user-friendly improvement you can easily implement within your surveys.
The known calibration problem in bounded scales, however, is not solved trough anchored assessments, so that is an issue that still needs attention.
Check out our dedicated manual page to learn how to annotate participants' previous answer to a slider scale.
In sum, our study shows that a simple visual cue can make a big difference in how we measure the complexity of human emotions in everyday life.
👉 Explore the full paper here: Psychological Assessment, 2024.